Tools
Here the tools provided by aiida-kkr are described.
Plotting tools
Visualize typical nodes using plot_kkr from aiida_kkr.tools.plot_kkr. The plot_kkr function takes a node reference (can be a pk, uuid or the node itself or a list of these) and creates common plots for a quick visualization of the results obtained with the aiida-kkr plugin.
Usage example:
from aiida_kkr.tools.plot_kkr import plot_kkr
# use pk:
plot_kkr(999999)
# use uuid:
plot_kkr('xxxxx-xxxxx')
# used actual aiida node:
from aiida.orm import load_node
plot_kkr(load_node(999999))
# give list of nodes which goups plots together
plot_kkr([999999, 999998, 'xxxx-xxxxx', load_node(999999)])
The behavior of plot_kkr can be controled using keyword arguments:
plot_kkr(99999, strucplot=False) # do not call ase`s view function to visualize structure
plot_kkr(99999, silent=True) # plots only (no printout of inputs/outputs to node)
List of plot_kkr specific keyword arguments:
silent(bool, default:False): print information about input node including inputs and outputs
strucplot(bool, default:True): plot structure using ase’sviewfunction
interpol(bool, default:True): use interpolated data for DOS plots
all_atoms(bool, default:False): plot all atoms in DOS plots (default: plot total DOS only)
l_channels(bool, default:True): plot l-channels in addition to total DOS
logscale(bool, default:True): plot rms and charge neutrality curves on a log-scale
Other keyword arguments are passed onto plotting functions, e.g. to modify line properties etc. (see matplotlib documentation for a reference of possible keywords to modify line properties):
plot_kkr(99999, marker='o', color='r') # red lines with 'o' markers
Examples
Plot structure node
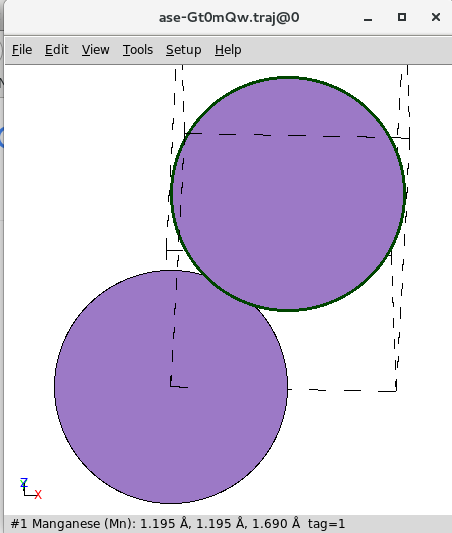
Visualize a structure node (also happens as sub-parts of workflows that have a structure as input if strucplot is not set to False). Shown is a screenshot of the ouput produced by ase’s view.
Plot output of a KKR calculation
Visualize the output of a KkrCalculation.
Plot output of kkr_dos_wc workflow
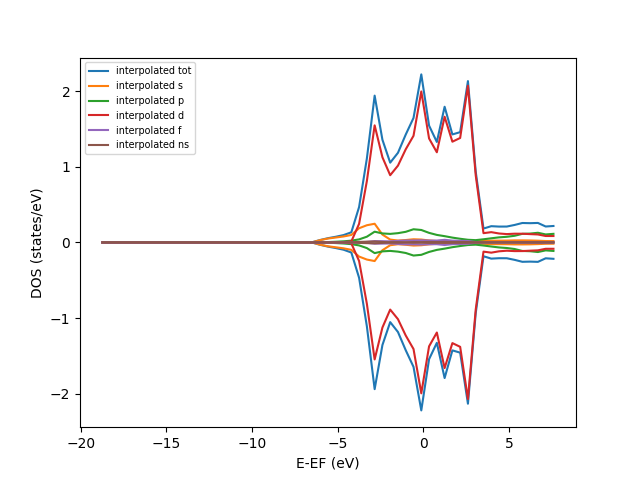
Visualize the output of a kkr_dos_wc workflow.
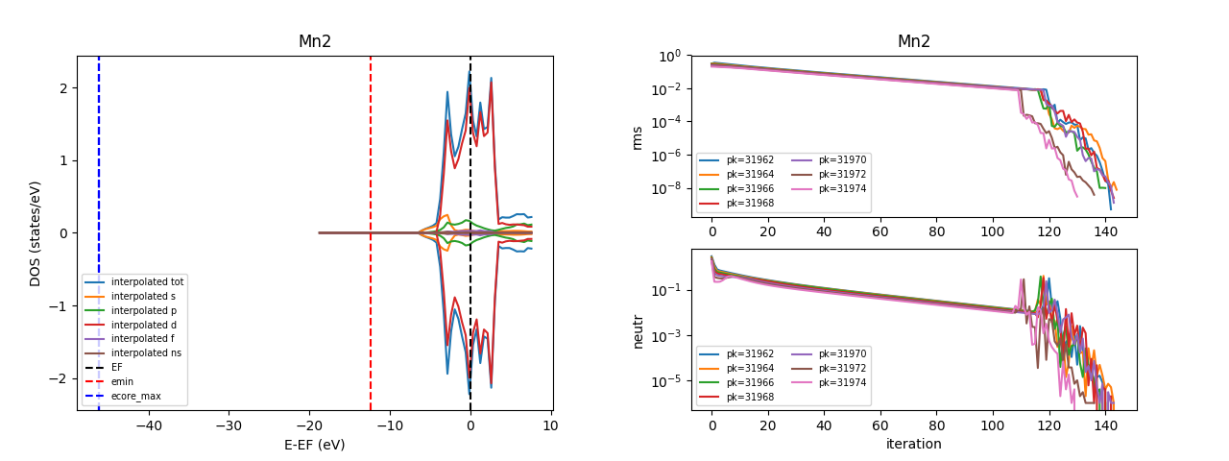
Plot output of kkr_startpot_wc workflow
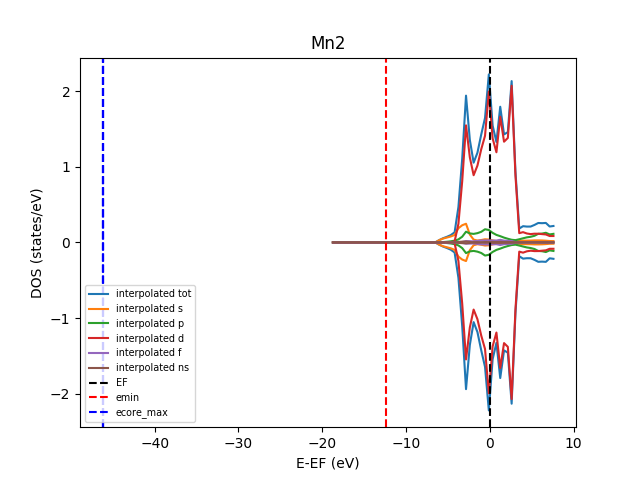
Visualize the output of a kkr_startpot_wc workflow. The starting DOS is shown and the vertical lines indicate the position of the highest core states, the start of the ernergy contour and the Fermi level.
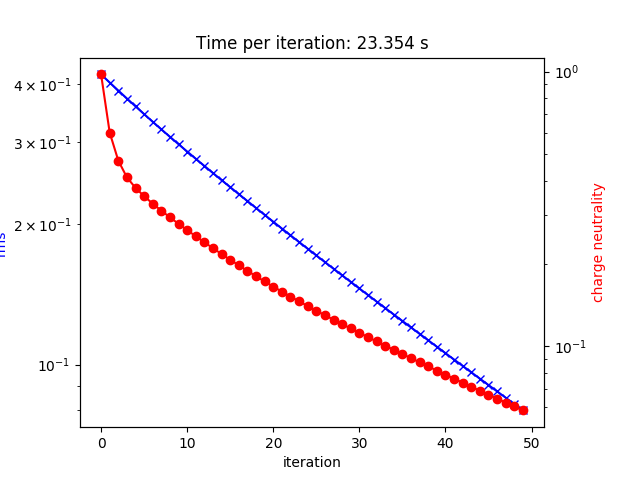
Plot output of kkr_scf_wc workflow
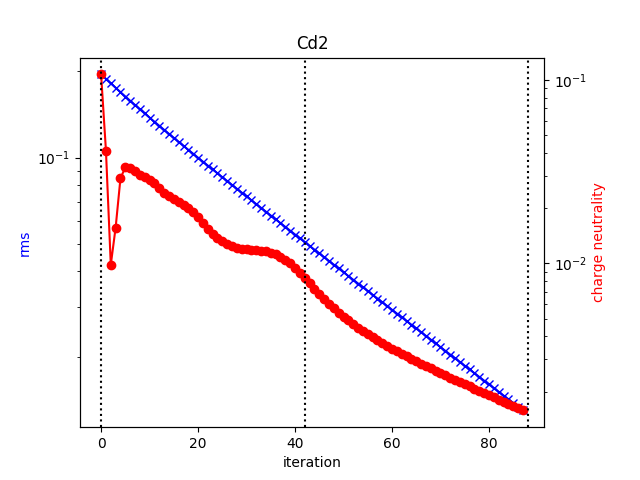
Visualize the output of an unfinished kkr_scf_wc workflow. The vertical lines indicate where individual calculations have started and ended.
Plot output of kkr_eos_wc workflow
Visualize the output of a kkr_eos_wc workflow.
Plot multiple KKR calculations at once in the same plot
plot_kkr([34157,31962, 31974], silet=True, strucplot=False, logscale=False)
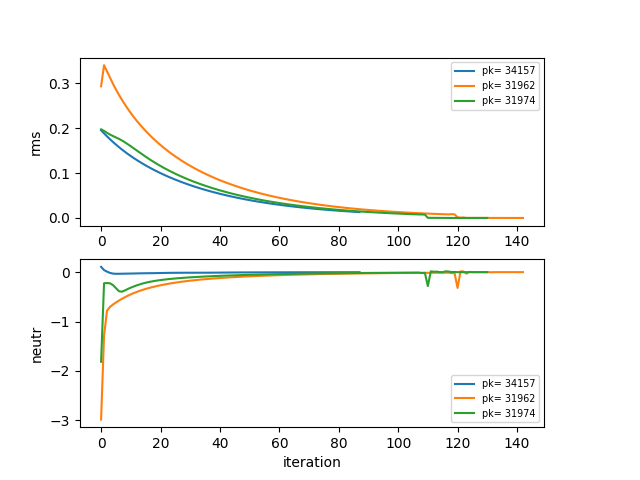
Visualize the output of multiple kkr_scf_wc workflows without plotting structure.